Marble and granite profitability is the key performance indicator that determines long term success for distributors and contractors in the natural stone industry. Every square meter counts not only in terms of material coverage but also in terms of margin optimization and net return. Understanding which stones generate the highest profit margins and how to optimize your stock mix, sourcing strategy, and pricing structure is essential for sustainable growth. In this guide, we break down a practical, step-by-step framework for maximizing profit per square meter with actionable insights that can be applied immediately to your projects.
The global natural stone and marble industry continues to expand, driven by infrastructure development and high end residential demand. According to Fortune Business Insights, the natural stone and marble market is projected to grow steadily with a strong CAGR over the coming years. This sustained growth reinforces the importance of focusing on marble and granite profitability to remain competitive in an expanding market.
Marble and Granite Profitability Starts with Understanding the True Cost Per Square Meter
Before you can maximize profit, you need to know the exact cost of each stone per square meter. Many distributors make the mistake of considering only the purchase price, overlooking other critical components that affect profitability.
Components of Cost:
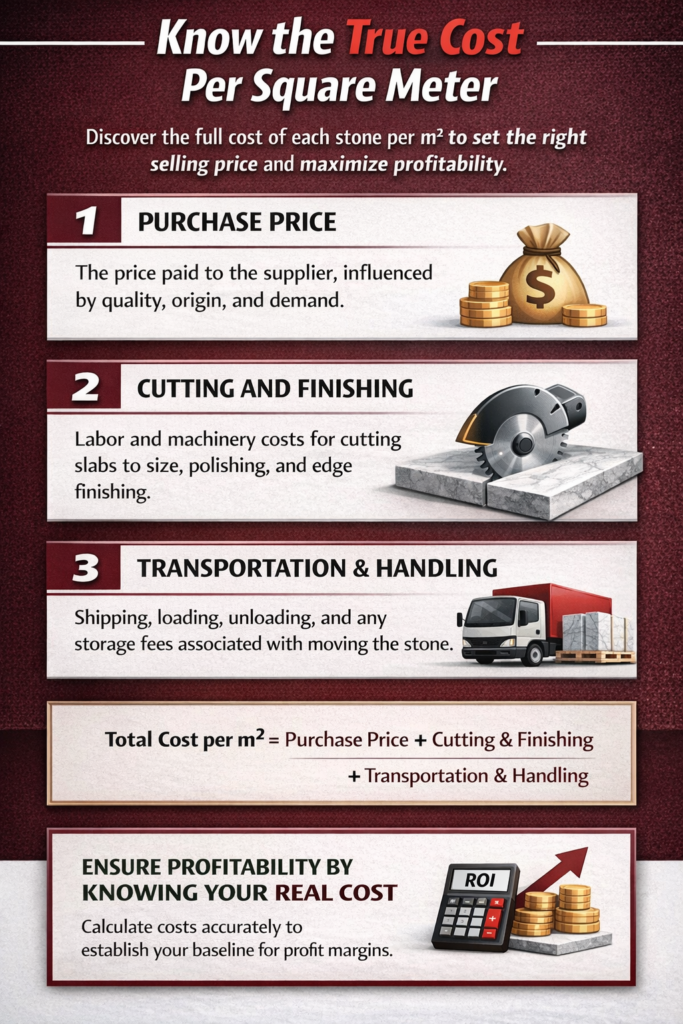
- Purchase Price: The price you pay to the supplier, which can vary depending on quality, origin, and demand.
- Cutting and Finishing: Labor and machinery costs for cutting slabs to the required dimensions, polishing, and edge finishing.
- Transportation and Handling: Shipping costs from the supplier to your warehouse, then to the customer’s site. This includes loading, unloading, and any storage fees.
Formula:
Total Cost per m² = Purchase Price + Cutting & Finishing + Transportation & Handling
By calculating these costs accurately, you can determine the minimum selling price needed to cover expenses and establish your baseline for profit margins.
Estimating the Average Selling Price by Application
The selling price of marble and granite depends heavily on the type of project. A stone that works well for flooring may command a lower price than the same stone used for luxury countertops or wall cladding. To maximize profit, distributors must understand the market value of each application.
Typical Applications and Pricing Patterns:
| Application | Pricing Potential | Notes |
|---|---|---|
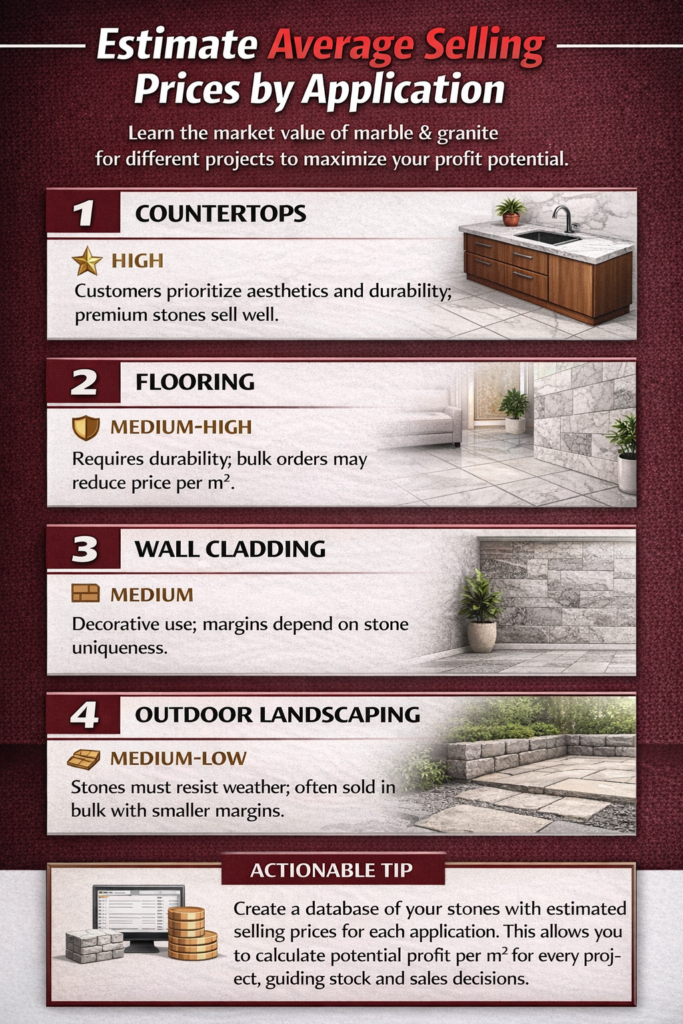
| Countertops | High | Customers prioritize aesthetics and durability; premium stones sell well. |
| Flooring | Medium-High | Requires durability; bulk orders may reduce price per m². |
| Wall Cladding | Medium | Decorative use; margins depend on stone uniqueness. |
| Outdoor Landscaping | Medium-Low | Stones must resist weather; often sold in bulk with smaller margins. |
Actionable Tip: Create a database of your stones with estimated selling prices for each application. This allows you to calculate potential profit per m² for every project, guiding stock and sales decisions.
Selecting Quantities Based on Profit Margins
Not all stones are created equal in marble and granite profitability. Some may be visually stunning but expensive to source, cutting into margins, while others may offer higher returns per square meter despite being less visually striking.
Steps to Optimize Quantities:
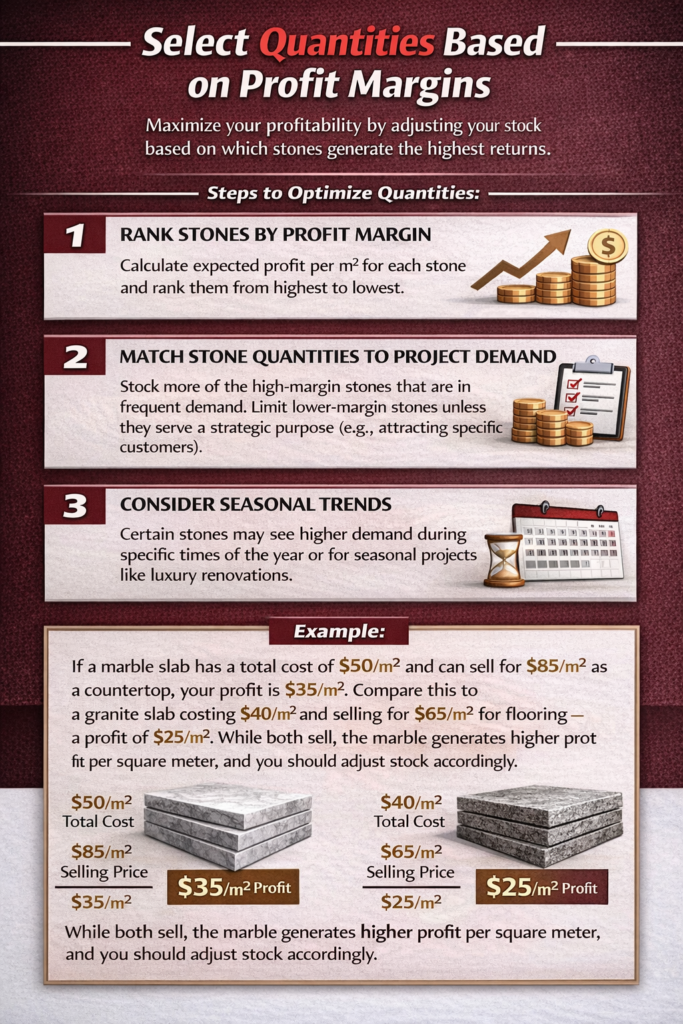
- Rank Stones by Profit Margin:
Calculate expected profit per m² for each stone and rank them from highest to lowest. - Match Stone Quantities to Project Demand:
Stock more of the high-margin stones that are in frequent demand. Limit lower-margin stones unless they serve a strategic purpose (e.g., attracting specific customers). - Consider Seasonal Trends:
Certain stones may see higher demand during specific times of the year or for seasonal projects like luxury renovations.
Example:
If a marble slab has a total cost of $50/m² and can sell for $85/m² as a countertop, your profit is $35/m². Compare this to a granite slab costing $40/m² and selling for $65/m² for flooring—a profit of $25/m². While both sell, the marble generates higher profit per square meter, and you should adjust stock accordingly.
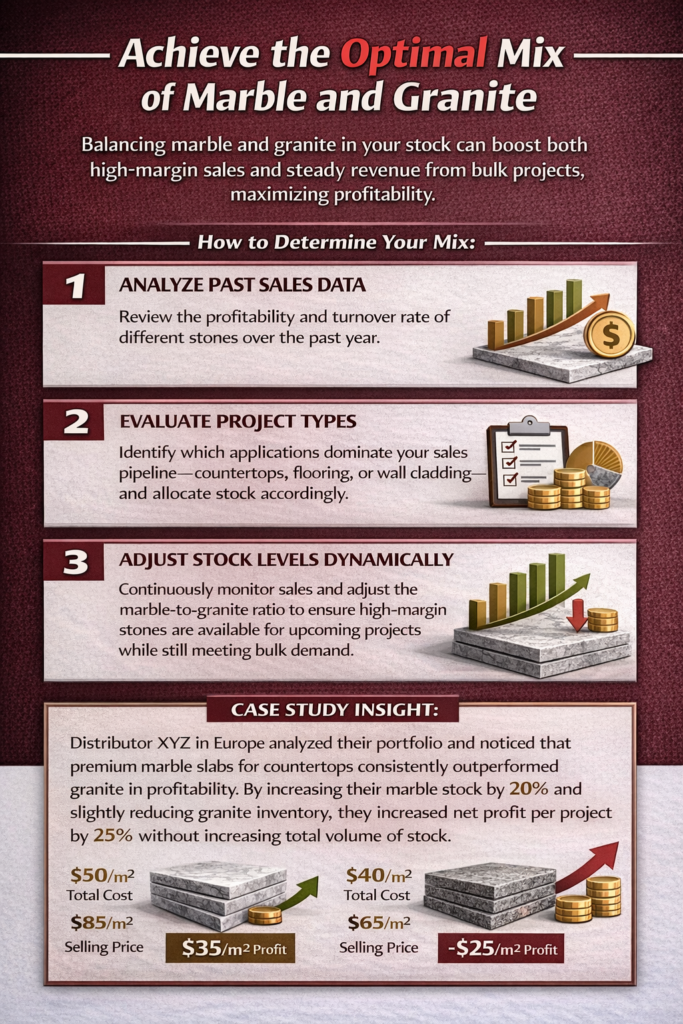
Achieving the Optimal Mix of Marble and Granite
A strategic blend of marble and granite can significantly enhance overall profitability. While marble often yields higher margins for premium applications, granite provides durability and steady sales for bulk projects. By finding the right balance, distributors can maximize profit without overstocking or creating unsellable inventory.
How to Determine Your Mix:
- Analyze Past Sales Data:
Review the marble and granite profitability and turnover rate of different stones over the past year. - Evaluate Project Types:
Identify which applications dominate your sales pipeline countertops, flooring, or wall cladding and allocate stock accordingly. - Adjust Stock Levels Dynamically:
Continuously monitor sales and adjust the marble-to-granite ratio to ensure high-margin stones are available for upcoming projects while still meeting bulk demand.
Case Study Insight:
Distributor XYZ increased marble and granite profitability by 25% after adjusting their stock mix and sourcing strategy.
in Europe analyzed their portfolio and noticed that premium marble slabs for countertops consistently outperformed granite in profitability. By increasing their marble stock by 20% and slightly reducing granite inventory, they increased net profit per project by 25% without increasing total volume of stock.
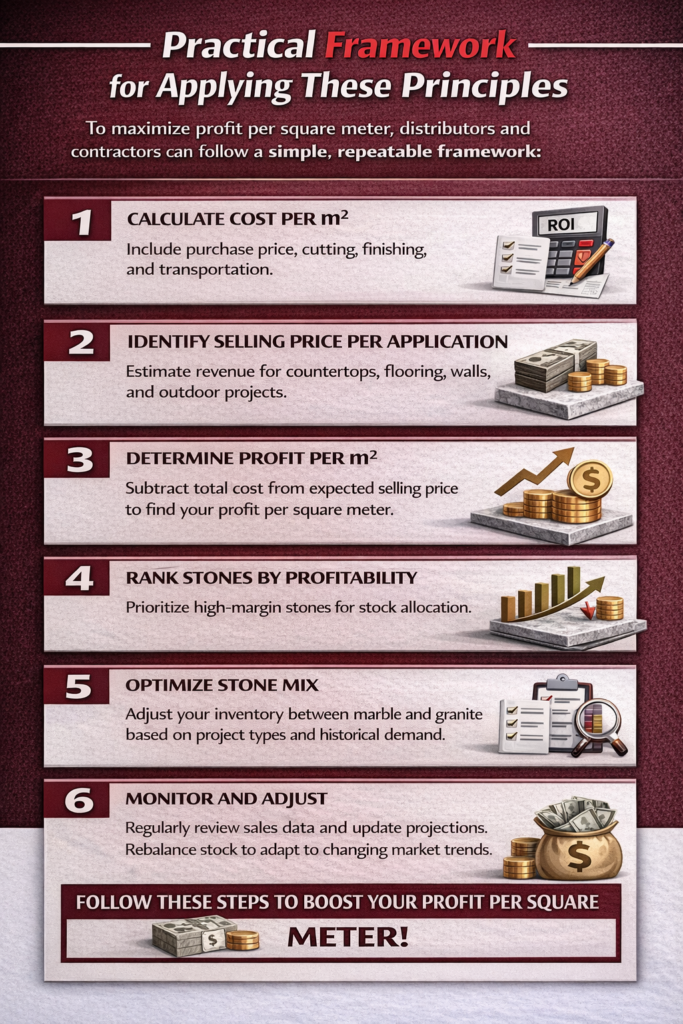
Practical Framework for Applying These Principles
To maximize marble and granite profitability per square meter, distributors and contractors can follow a simple, repeatable framework:
Step 1: Calculate Cost per m²
Include purchase price, cutting, finishing, and transportation.
Step 2: Identify Selling Price per Application
Estimate revenue for countertops, flooring, walls, and outdoor projects.
Step 3: Determine Profit per m²
Subtract total cost from expected selling price to find your profit per square meter.
Step 4: Rank Stones by Profitability
Prioritize high-margin stones for stock allocation.
Step 5: Optimize Stone Mix
Adjust your inventory between marble and granite based on project types and historical demand.
Step 6: Monitor and Adjust
Regularly review sales data and update projections. Rebalance stock to adapt to changing market trends.
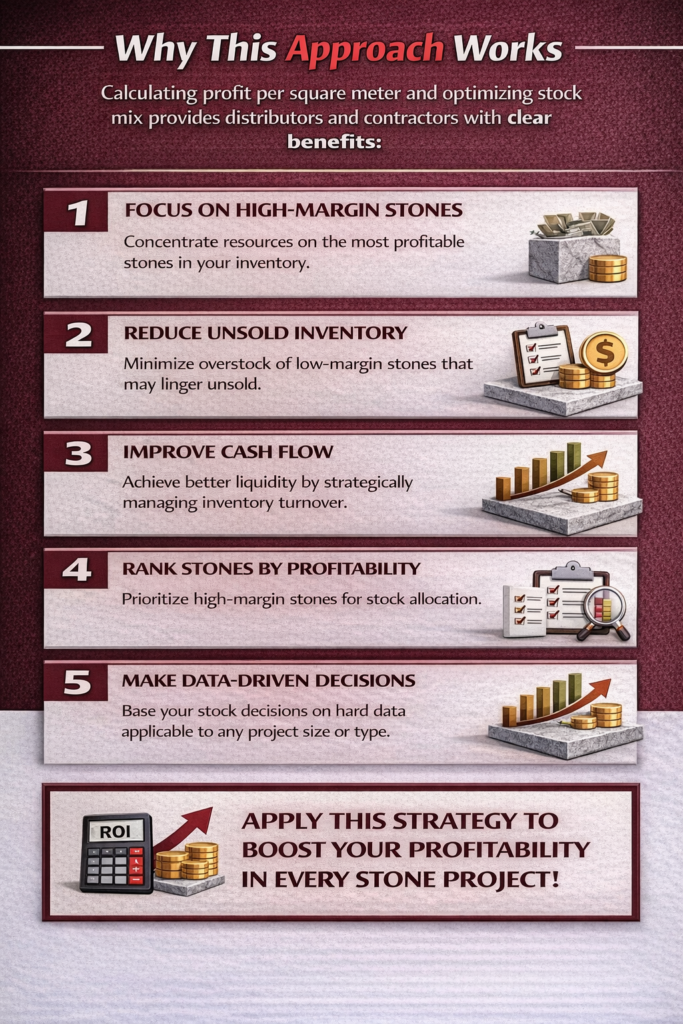
Why This Approach Works
This method works because it provides distributors and contractors with a quantitative and actionable approach rather than relying on intuition or trends alone. By calculating profit per square meter and optimizing stock mix:
- You focus resources on high margin stones.
- Reduce risk of unsold inventory.
- Improve cash flow through strategic stock management.
- Make data-driven decisions that can be applied to any project size or type.
Bonus: Common Mistakes to Avoid
Even with a strong strategy, small mistakes can erode profits. Here’s what to watch out for:
- Ignoring Cutting and Transportation Costs: Overlooking these can make high margin stones less profitable than they appear.
- Overstocking Low-Demand Stones: Ties up capital and reduces overall profitability.
- Underestimating Application-Specific Demand: Failing to account for which stones sell best for certain projects can leave high-margin inventory unused.
- Neglecting Market Trends: Luxury trends or seasonal demand shifts can affect which stones generate the highest profit.
Final Thoughts
Maximizing marble and granite profitability per square meter in the marble and granite industry is less about luck and more about a structured, analytical approach. By calculating true costs, estimating realistic selling prices, optimizing quantities, and adjusting your marble to granite mix, distributors can see tangible improvements in net profit while minimizing risks.
Remember, profitability is not just about selling more it’s about selling smarter. The example of Distributor XYZ shows that even small adjustments in stock allocation and project targeting can deliver a 25% increase in profit, a figure that can be replicated in any market with careful planning and data-driven decision-making.
Ultimately, marble and granite profitability is not determined by volume alone, but by how efficiently each square meter is sourced, priced, and positioned in the market. By applying this framework consistently, you can transform your stone distribution business from reactive to highly profitable, one square meter at a time.